x
# We need this line of code to show graphs in our compilerbitmap(file="out.png")x <- c("A", "B", "C", "D")y <- c(2, 4, 6, 8)barplot(y, names.arg = x, density = 10)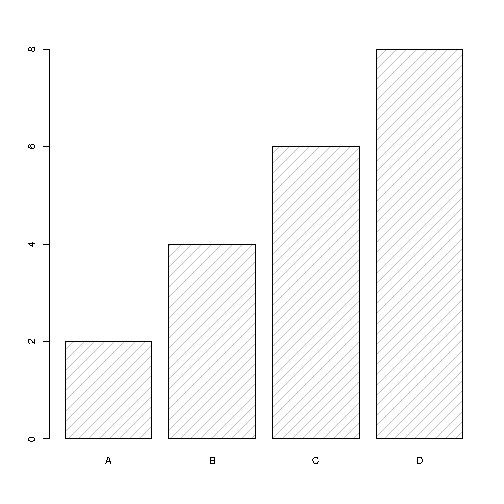
# We need this line of code to show graphs in our compilerbitmap(file="out.png")x <- c("A", "B", "C", "D")y <- c(2, 4, 6, 8)barplot(y, names.arg = x, density = 10)